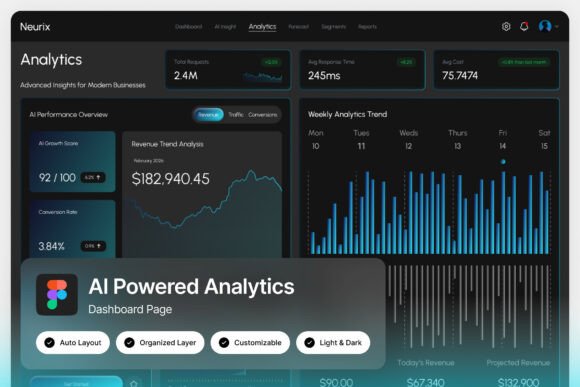
Neurix AI Powered Analytics Dashboard: A Dark-Themed UI for Data Storytelling
Imagine opening a dashboard that feels less like a spreadsheet and more like a mission control center for your business. That’s the immediate impression with the Neurix AI Powered Analytics Dashboard. It’s a meticulously crafted interface where data doesn’t just sit in rows—it moves, pulses, and communicates through bold, waveform-style charts and stark, high-contrast metric cards. For anyone building a tech startup, managing a data-heavy project, or designing a business intelligence platform, this isn't just another template; it's a foundational asset for presenting complex information with clarity and a sharp, modern edge.
The Visual Language of Advanced Data
What sets a tool like the Neurix dashboard apart is its understanding that data visualization is a form of visual communication. The dark theme isn't merely an aesthetic choice; it reduces eye strain during long analysis sessions and makes neon accent colors pop with incredible precision, guiding the user's eye to the most critical insights. The bold typographic hierarchy ensures that key numbers and labels are immediately legible, which is crucial when you're making fast, data-driven decisions. This kind of thoughtful design goes beyond mere decoration—it builds trust in the data itself. When your metrics are presented within a pixel-perfect, professionally designed environment, the entire narrative of your business performance feels more credible and authoritative.
Beyond the Dashboard: Real-World Applications
While the primary use case is clear, the design principles and assets within the Neurix package have surprising versatility. The included high-resolution screens (at a crisp 1440×1024 px) are perfect for creating compelling case studies, investor pitch decks, or marketing materials that showcase your product's capabilities. A screenshot of a sleek, active dashboard can become a hero image for your website's homepage, a powerful visual for a social media ad campaign, or the centerpiece of a blog post explaining your service's value. For designers, this resource is a masterclass in modern UI trends—dark mode interfaces, strategic use of color, and data-centric layouts—that can inspire other projects, from app design to interactive digital reports.
Practical Guidance for Implementation
Getting the most out of a resource like this involves more than just a quick download. Here’s how to integrate it effectively into your workflow:
- Customization is Key: The true value lies in the fully customizable Figma file. Don’t just use it as-is. Swap out the placeholder data with your own metrics. Adjust the neon accent colors to align with your existing brand palette. This transforms a generic template into a bespoke part of your brand identity toolkit.
- Leverage the Organized Layers: The well-named, grouped layers are a huge time-saver. This structure makes it simple to isolate specific elements, like a single chart or metric card, to repurpose them in other designs, such as a monthly newsletter graphic or a social media infographic.
- Font Pairing and Readability: The package includes links to free Google Fonts, which is a thoughtful touch. When adapting the design, consider how these fonts pair with your primary brand typeface. The goal is seamless visual consistency. Test the legibility of the typography at different sizes, especially for the real-time metric cards, to ensure it remains clear in all contexts.
- Understand the Scope: The note that preview images aren't included is a standard but important reminder. This is a UI kit for the dashboard interface itself. You’ll need to source your own imagery if you wish to create mockups showing the dashboard on devices or in specific environments.
A Strategic Asset for Tech and Data-Focused Brands
For tech startups and data-driven companies, the Neurix AI Powered Analytics Dashboard is more than a design file—it’s a strategic asset for visual communication. In a crowded market, the way you present your technology can be a significant differentiator. A polished, intuitive interface signals sophistication, reliability, and a user-centric mindset. It helps in building a cohesive brand experience, from the product your customers use to the marketing materials they see. By adopting a high-contrast, data-storytelling approach, you can create a consistent and engaging visual language that resonates with a professional audience, enhances brand recognition, and ultimately, makes your complex offerings feel accessible and powerful.