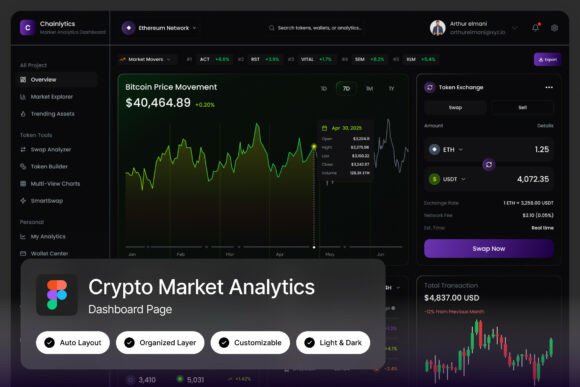
Chainlytics: A Futuristic Crypto Analytics Dashboard Template
If you've ever tried to build a blockchain platform or a cryptocurrency market tracker, you know the headache. The data is dense, the audience is savvy, and the interface needs to scream "cutting-edge" without sacrificing usability. It’s a massive design challenge that can eat up weeks of development time. That is exactly the problem the Chainlytics Crypto Market Analytics Dash was built to solve. It isn’t just a collection of charts; it is a comprehensive, futuristic layout system designed specifically for the high-stakes world of digital asset monitoring.
For designers, developers, and crypto entrepreneurs, this template serves as a powerful launchpad. It bridges the gap between raw blockchain data and a polished, professional user experience. Instead of starting with a blank canvas, you are handed a pixel-perfect blueprint that understands the specific visual language of DeFi and Web3. The design moves beyond standard web layouts, embracing the dark, neon-accented aesthetics that modern crypto users expect, while maintaining the structure required for complex data visualization.
Visualizing the Invisible: Data Meets Design
The core appeal of this dashboard lies in its ability to make complex information digestible. In the world of cryptocurrency, trust is visual. A sloppy interface suggests a risky investment, whereas a sleek, organized dashboard implies stability and professionalism. Chainlytics addresses this by offering high-resolution layouts (1440×1024 px) that give every chart, graph, and transaction log ample breathing room.
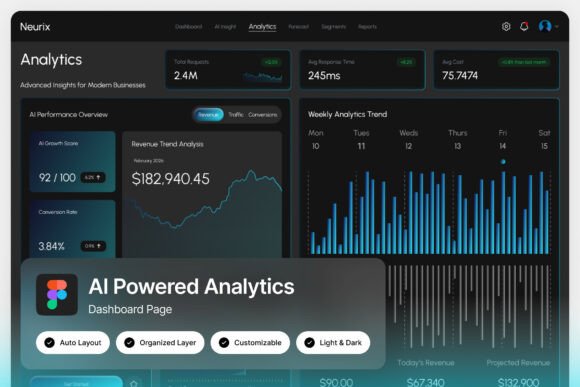
What makes this modern typography and layout system stand out is the duality of its interface. It comes equipped with both Light and Dark mode interfaces. This is crucial for web design in the financial sector. Many traders prefer "Dark Mode" to reduce eye strain during long trading sessions, while institutional clients might prefer a crisp "Light Mode" for reporting. Having both options ready to go allows you to tailor the user experience to your specific audience without redesigning the wheel.
The unique, stylish, and modern design isn't just about looking cool; it's about hierarchy. The layout prioritizes the most critical data points—portfolio value, market trends, and transaction history—using visual weight and contrast. It utilizes advanced data visualization components that go beyond simple bar graphs, incorporating radial charts and heat maps that feel native to the blockchain ecosystem.
Practical Applications: Beyond the Dashboard
While the primary function of Chainlytics is clearly market tracking, the assets included in the Figma file are versatile enough for a variety of digital products and marketing assets. If you are building a brand in the Web3 space, consistency is your greatest asset.
Here is how you can leverage this template across different touchpoints:
- Brand Identity & Pitch Decks: The futuristic financial layouts are perfect for investor presentations. You can easily extract the color palettes and typography to create a cohesive brand identity that extends from your product to your pitch deck.
- Social Media Graphics: The high-contrast elements and data visualization styles translate beautifully to social media graphics. Use the dashboard elements to create "market update" posts for Twitter or Instagram that look professional and authoritative.
- Blog & Editorial Design: If you run a crypto publication or a company blog, the editorial layouts within the template can help structure long-form articles, ensuring that even text-heavy content feels dynamic and engaging.
- App Interfaces: Beyond a desktop dashboard, the components are organized in a way that makes them scalable for mobile-first designs, essential for traders who need to monitor assets on the go.
The Designer’s Workflow: Customization and Usability
One of the biggest pain points with premium design assets is the "black box" effect—you buy a file, and it takes hours just to figure out how the layers are grouped. Chainlytics solves this with a focus on well-organized, named, and grouped layers. This attention to detail is a massive time-saver. Whether you are a seasoned Figma pro or a small business owner trying to make quick tweaks, the easy editing process means you can swap out colors, change fonts, or rearrange modules in minutes rather than hours.
The inclusion of Free Google Fonts is another practical advantage. It ensures that your final product remains cost-effective and easy to implement in code. You don't need to worry about expensive licensing fees for the typeface, making the transition from design to development seamless. The pixel-perfect layout ensures that what you see in the design file is exactly what you get in the browser, reducing the back-and-forth between designer and developer.
Strategic Visual Communication
Using a template like this is about more than just saving time; it's about borrowing visual credibility. In the crowded crypto market, a premium font choice and a sophisticated layout can be the difference between a user trusting you with their funds or bouncing to a competitor.
When working with the Chainlytics Crypto Market Analytics Dash, consider the following to maximize impact:
- Match Typography to Tone: The included fonts are likely sans serif or geometric styles, which convey modernity and efficiency. If you are branding a DeFi protocol, stick with these. If you are building a more community-focused NFT platform, you might experiment with pairing the dashboard's clean text with a more playful display font for headers.
- Color Psychology: In finance, green means up and red means down. The template likely adheres to this standard, but ensure your custom brand colors don't clash with these functional indicators. Visual consistency helps users process information faster.
- Hierarchy of Information: Use the dashboard's structure to guide the eye. Don't clutter the main view with too many "call to action" buttons. Let the data breathe. The design is built to handle information density; trust the layout.
Ultimately, this asset is a tool for visual communication. It translates the abstract concept of "blockchain data" into tangible, interactive graphics. For the entrepreneur or designer looking to launch a crypto platform, it offers a shortcut to a professional, high-end aesthetic that would otherwise require a significant investment in custom UI design. It’s a practical, stylish foundation for anyone serious about making an impact in the digital asset space.